Fundamental Analysis: Reasons Behind the Recent Crude Oil Rally
West Texas Intermediate (WTI) crude oil prices have shown a strong bullish trend in recent days, reaching levels not seen since August 2024. Below are the main drivers behind this movement, explained in detail:
🔹 New U.S. Sanctions on Russian Oil
- Context: The United States imposed additional restrictions, sanctioning nearly 200 vessels transporting Russian oil, along with major producers like Gazprom Neft and Surgutneftegaz.
- Impact: These sanctions disrupt Russian exports, affecting approximately 1.7 million barrels per day (25% of Russia's exports).
- Market Reaction: The anticipated drop in global supply drives prices higher, as India and China must turn to more expensive markets such as the Middle East, Africa, and the Americas.
🔹 Speculation on New Sanctions Against Iran
- Context: Rumors suggest that Donald Trump's administration might tighten sanctions on Iranian crude flows.
- Impact: The potential for increased restrictions on Iranian oil supply heightens concerns over tighter global supply, adding upward pressure on prices.
🔹 Technical Buying at Key Levels
- Context: WTI broke above its 200-day Simple Moving Average (SMA) for the first time since August 2024, a significant technical milestone for traders.
- Impact: This triggered automated buying from algorithms and technical traders, amplifying the rally.
- Warning: However, an RSI nearing overbought levels could limit further short-term gains.
🔹 Market Structure in Backwardation
- Context: Crude prices for immediate delivery are higher than futures prices, signaling a tight supply market.
- Impact: This pattern encourages additional buying as traders seek to secure supply before prices rise further.
🔹 Limited OPEC+ Response Capacity
- Context: While OPEC+ holds approximately 5.86 million barrels per day in spare capacity, it is insufficient to offset the impact of sanctions fully.
- Impact: This sustains expectations of a tight market, reinforcing current price levels.
🔹 Strong Dollar as a Partial Headwind
- Context: Expectations of a less dovish Federal Reserve have strengthened the U.S. dollar, making crude more expensive for international buyers.
- Impact: While it dampens gains, concerns over global supply remain the dominant market force.
🔹 Price Projections from Goldman Sachs
- Projection: Goldman Sachs analysts now expect Brent prices to surpass their projected $70–85 per barrel range due to logistical challenges and sanctions.
In summary, the recent crude rally stems from geopolitical, technical, and structural market factors. Although a strong dollar might act as a headwind, expectations of tight global supply continue to drive prices higher.
Technical Analysis
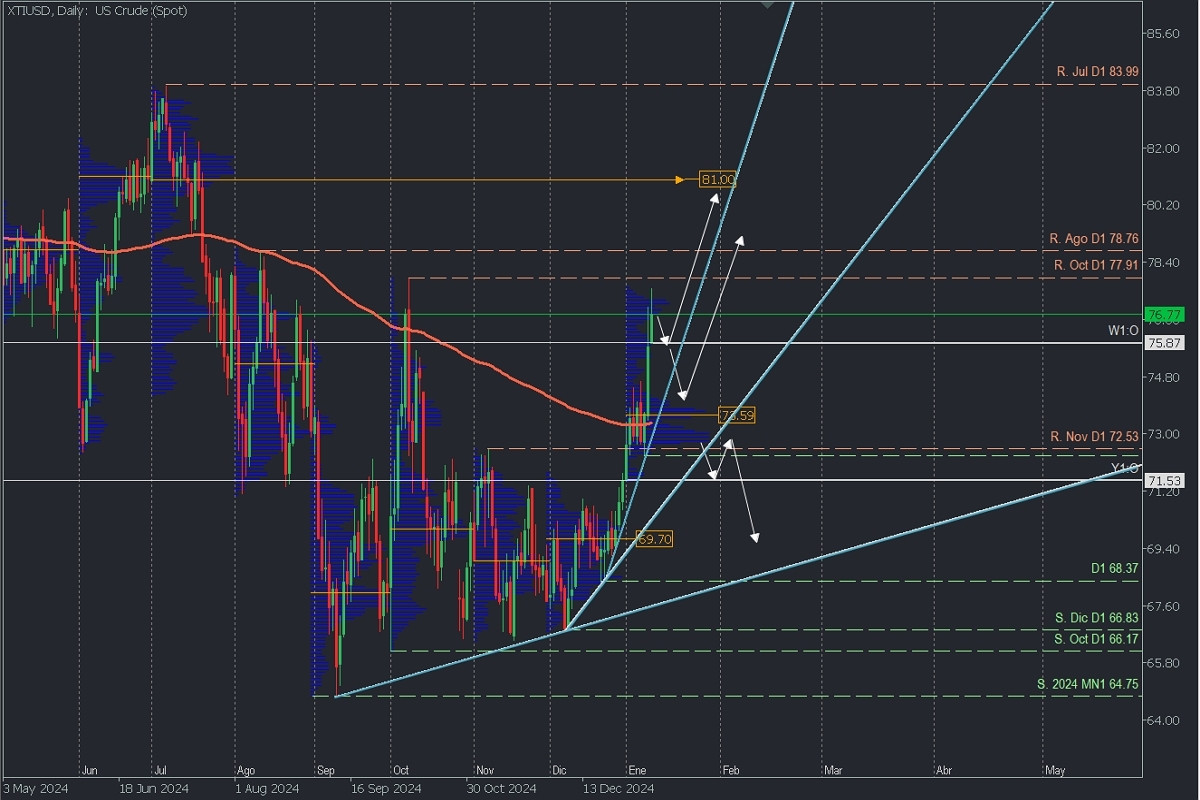
XTIUSD, Daily Chart

- Supply Zones (Sell): $81.00 (July 2024 POC).
- Demand Zones (Buy): $73.61 (Current January POC, subject to change).
The price rally since December shows clear acceleration, breaking above the 200-day SMA last week, signalling strength. The current momentum, surpassing $77.00 per barrel, positions the macro support at $72.31. Alongside the broken November resistance (now support) at $72.53 and volume concentrations near $73.00 and $73.61, these form the final macro demand zone for potential liquidity correction.
- Bullish Continuation: Targets include breaking resistance levels between $77.91 and $78.76 from October and August, with an extension toward the July uncovered POC at $81.00. This scenario holds as long as sellers don’t breach the macro support at $72.31.
- Bearish Reversal: Confirmed if the price falls below $72.31, opening a path to seek liquidity near the December demand zone around $69.70.
Uncovered POC Explanation: POC (Point of Control) refers to the level or zone where the highest volume concentration occurred.
- If it previously led to a bearish move, it’s considered a resistance (sell zone).
- Conversely, if it preceded a bullish move, it’s considered support (buy zone), typically at lows.


